Demonstration · Illustrative data · BI Consulting Services
StriveTogether × BI Consulting Services
Network Outcomes Board · cradle-to-career milestones by partnership and Theory of Action gateway · embedded-report ready
Prepared for Brandon September 2026 · School year 2024–25 in view
Signature view · the network's cradle-to-career pathway
Where the pathway narrows: on-track share at each of six milestones, focus group vs. comparison group
Ribbon thickness = share of the cohort on track. The teal band is the comparison group; the orange band inside it is the focus group (students from low-income households). The hatched sliver between them is the equity gap. Hover a milestone station for detail.
Comparison group on trackFocus group on trackEquity gap (percentage points)Widest gap in view
Trend · eight school years
Weighted by children reached in each partnership. Dashed line marks the 2030 network target for this milestone.
All studentsComparison groupFocus group
What this board answers
Three questions the network asks every fall
Every answer recalculates with the filters above; in Power BI the same measures drive the embedded partner-portal report through row-level security, so each partnership sees its own answer.
By Theory of Action gateway
Milestone on-track rate by gateway stage
Rows are the five gateways of the StriveTogether Theory of Action; cells are the weighted on-track rate, with partnership counts in the region filter.
Ranking · partnerships in view
Teal bar = on-track rate; hatched extension = the equity gap. Top 12 shown; the rest roll into the totals.
Equity gap view
Focus group vs. comparison group at every milestone
Dot pairs per milestone; the connecting bar is the gap in percentage points. Arrow shows the change since the prior school year (green = narrowing).
Embedded-report readiness
Partner-portal embed status, one tile per partnership
Live = report embedded in the partner portal with a row-level-security role mapped; Ready = RLS role mapped, awaiting publish; Pending = outcome data feed not yet certified.
Live in portalReady to publishData feed pending
Demonstration · Illustrative data · BI Consulting Services
Also from BI Consulting Services
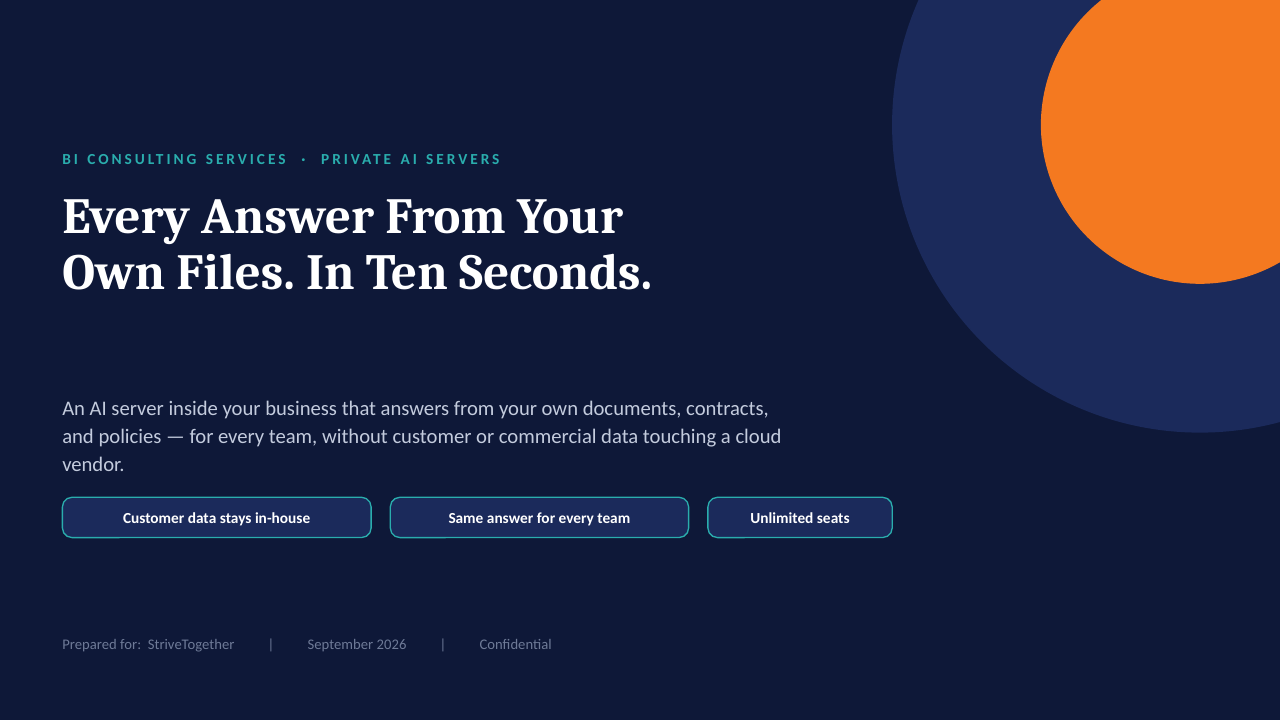
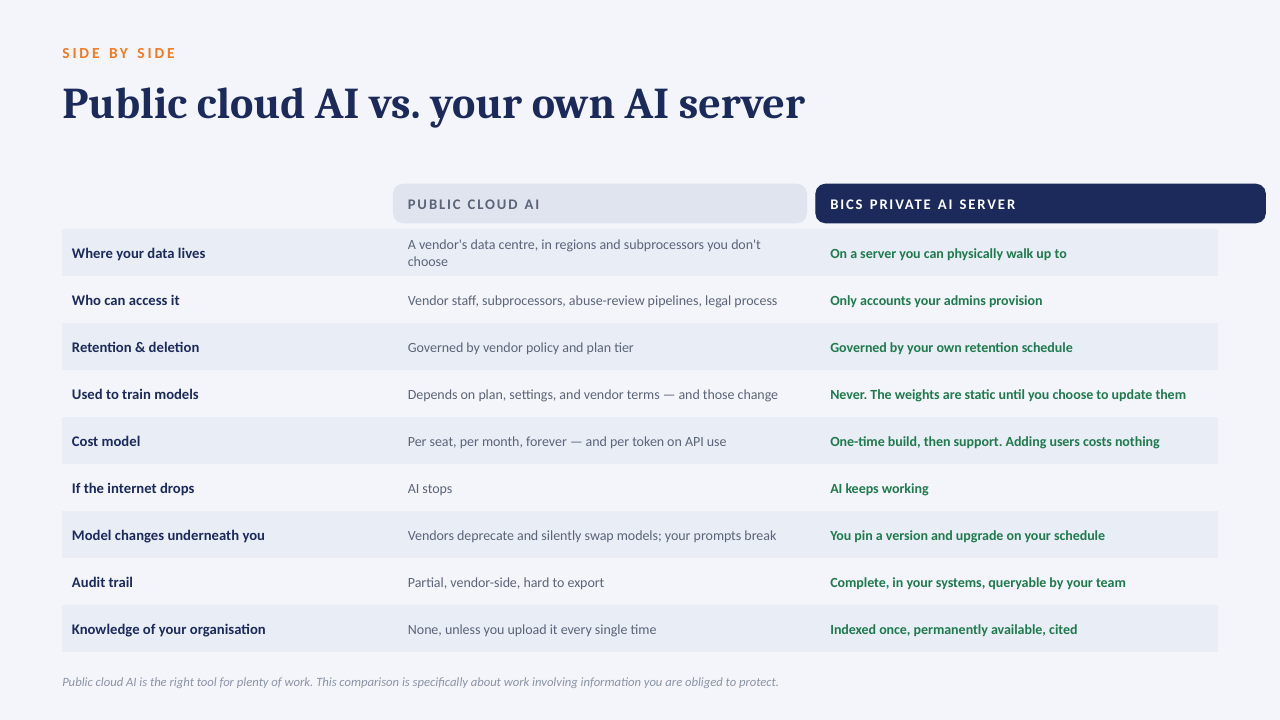
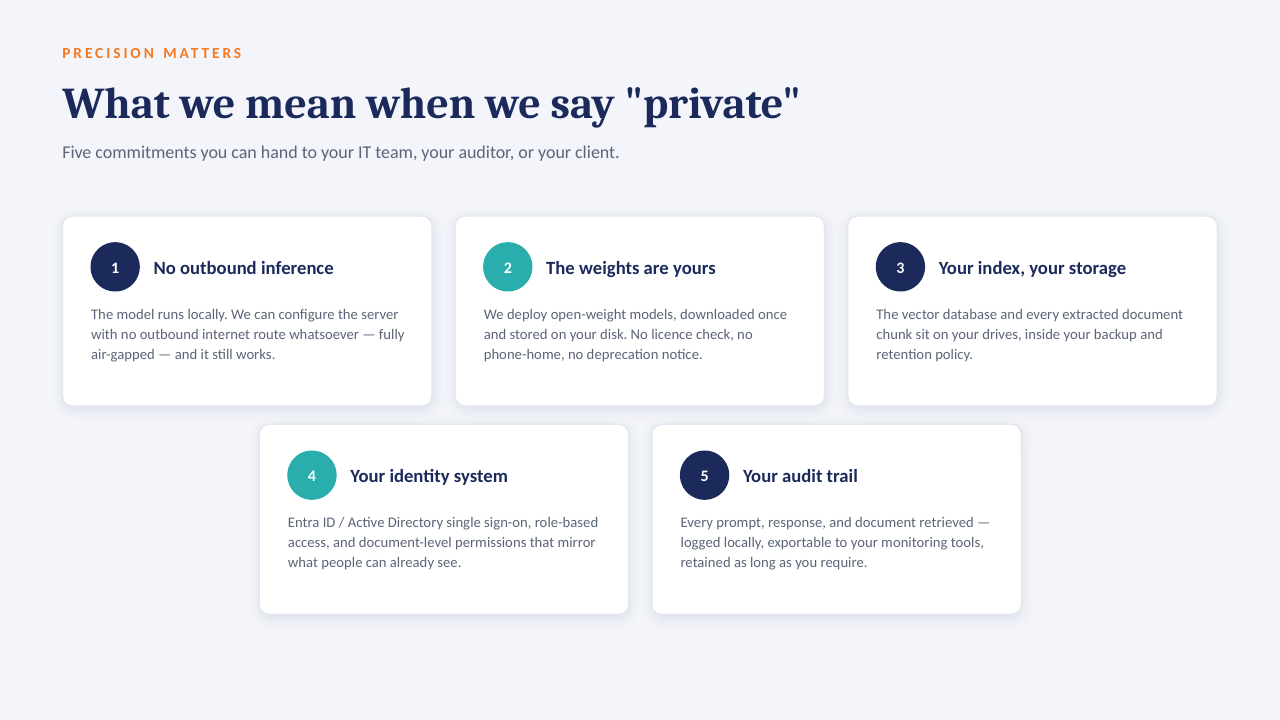
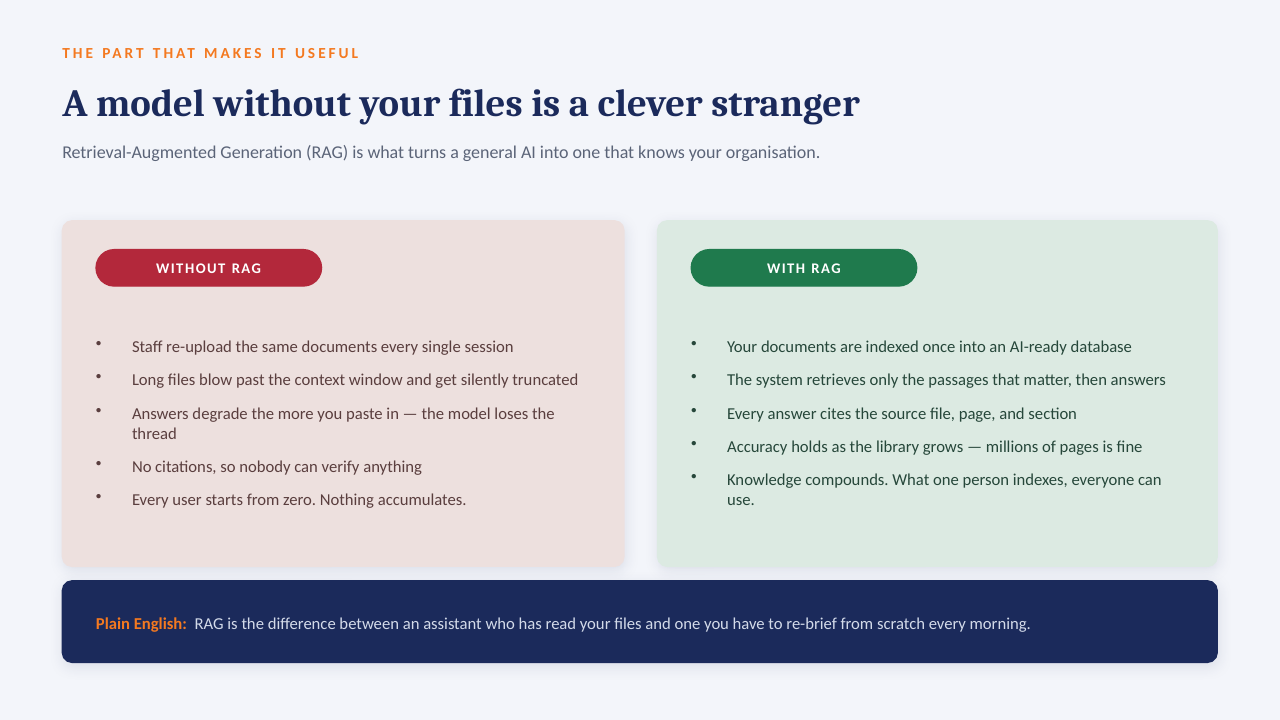
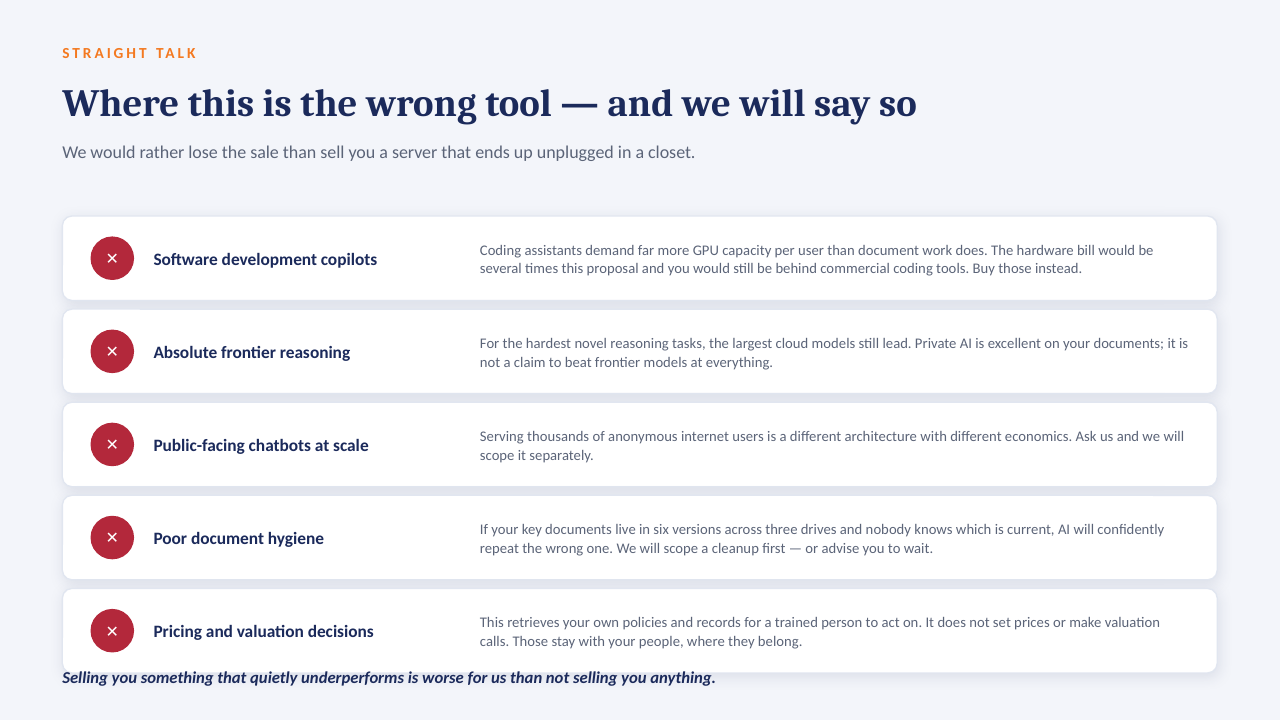
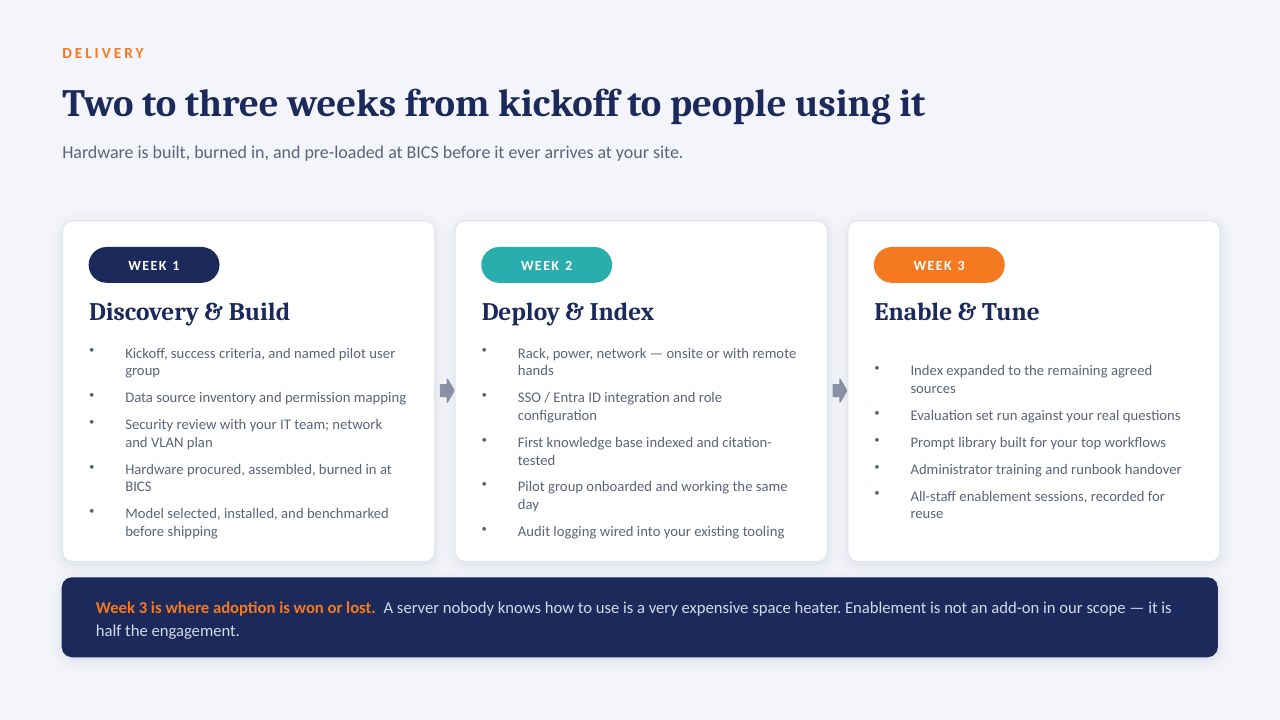
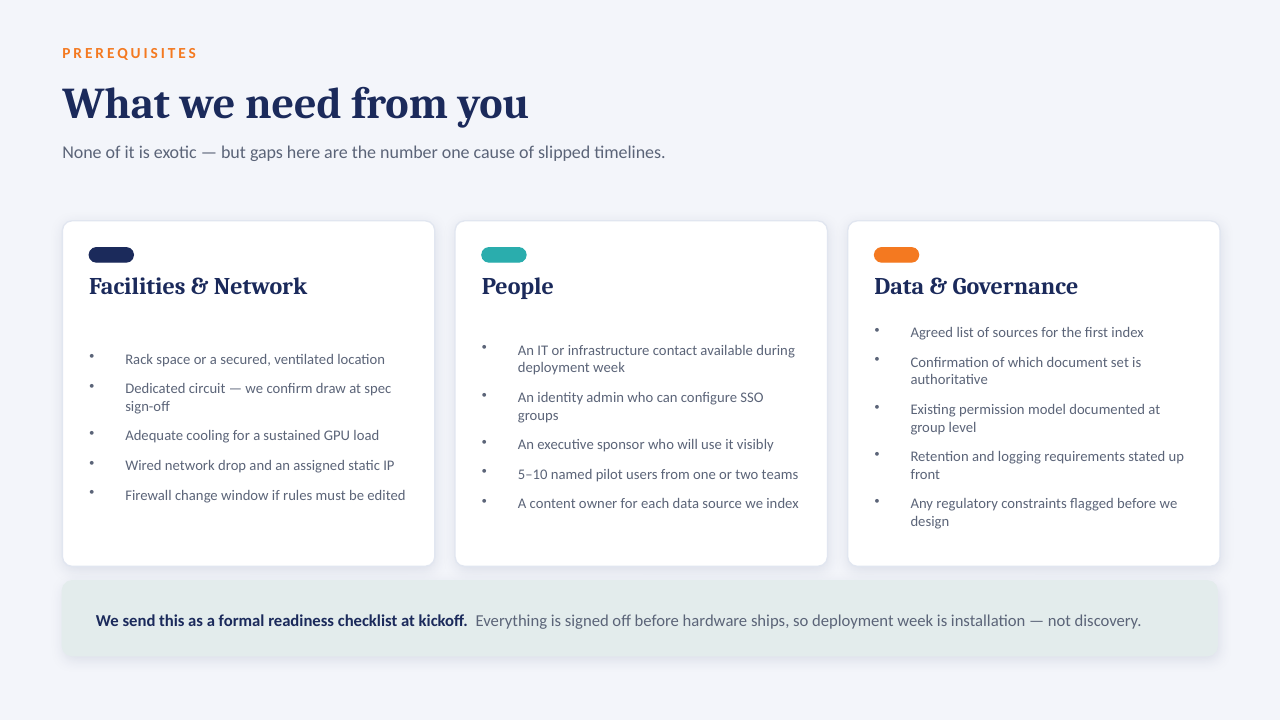
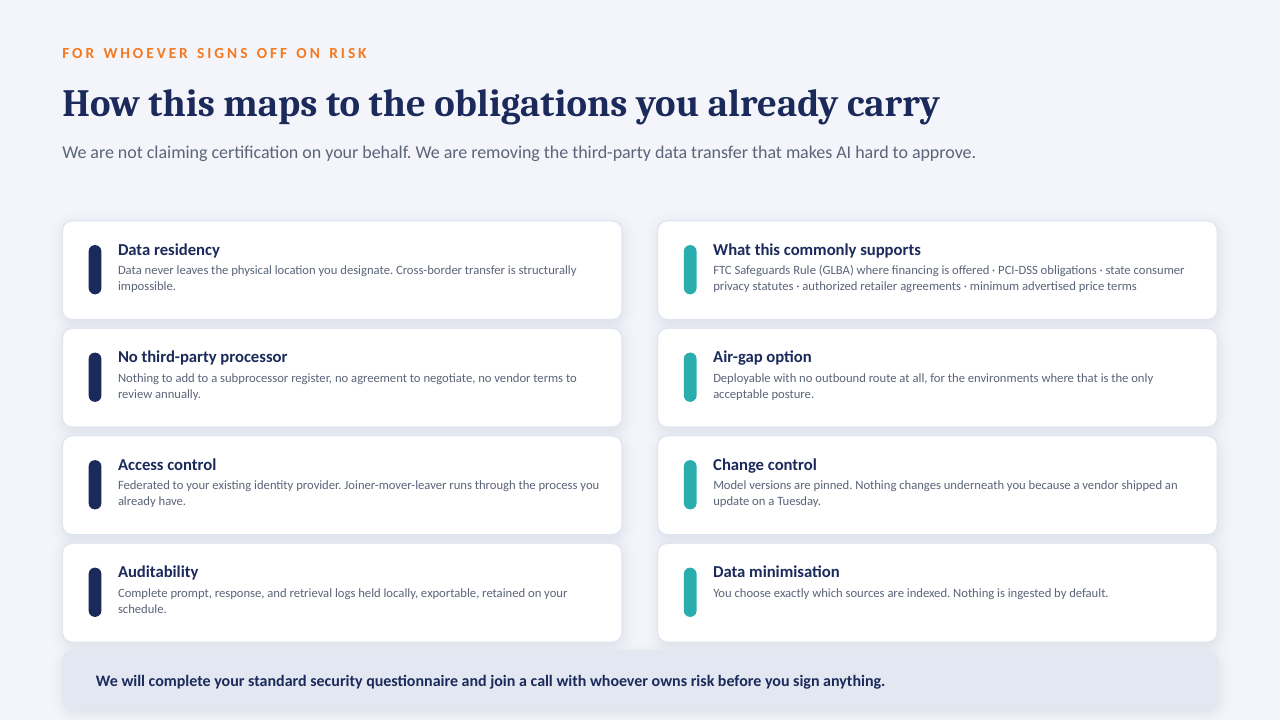
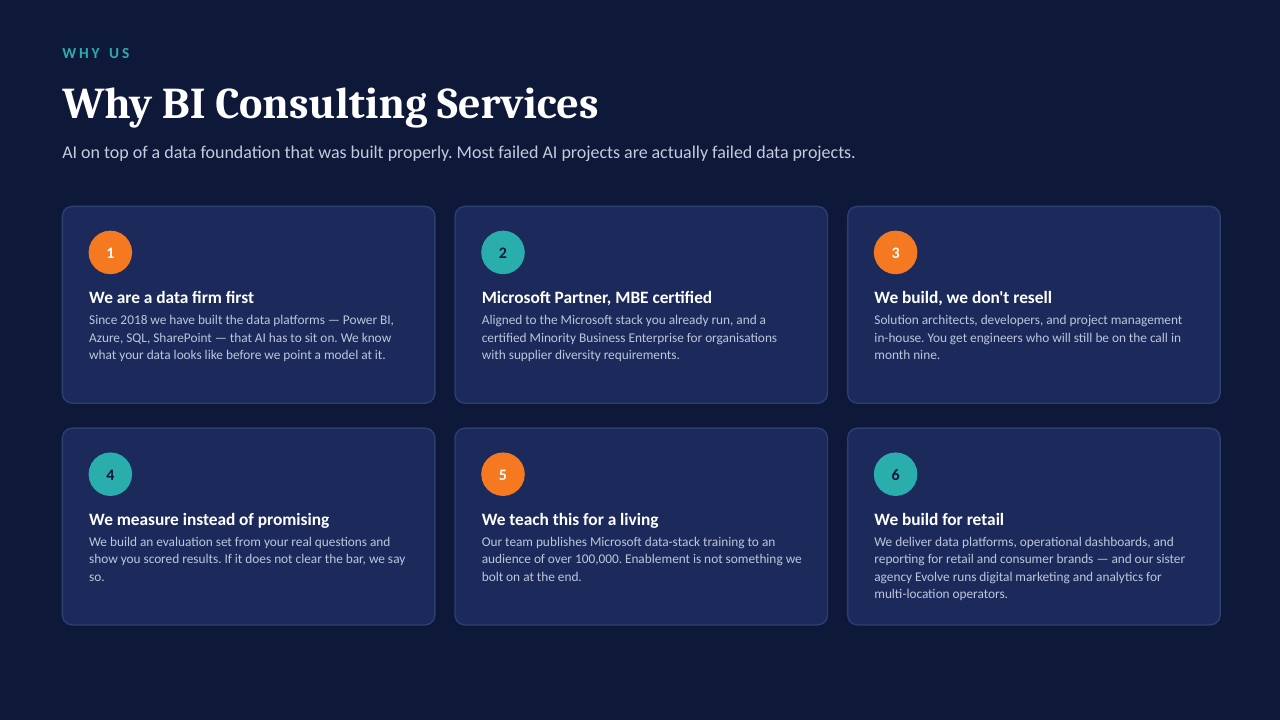
Private AI on your own server
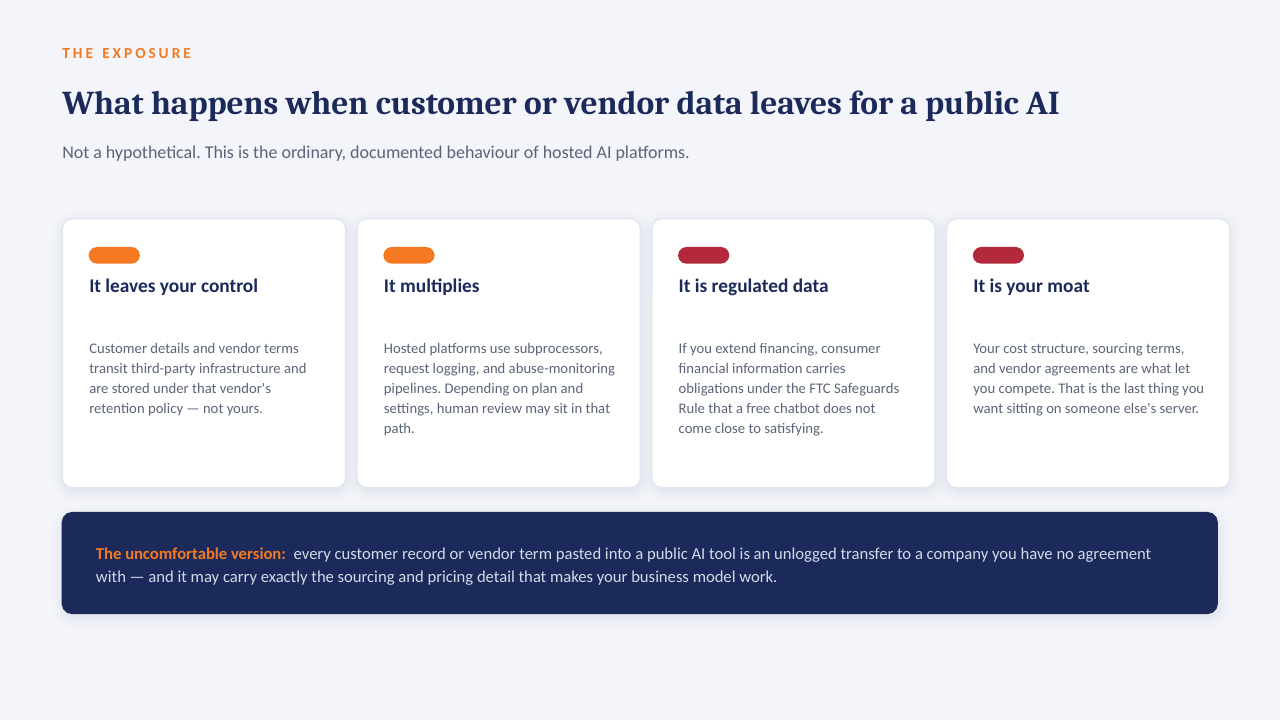
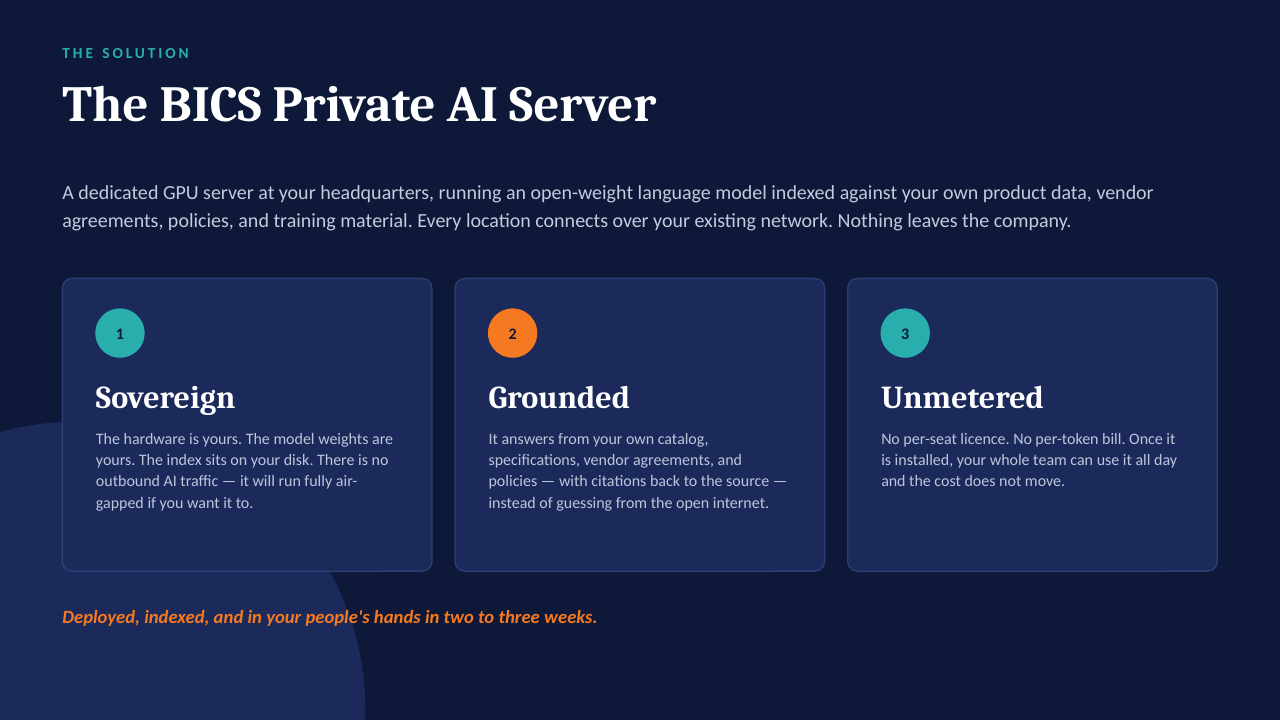
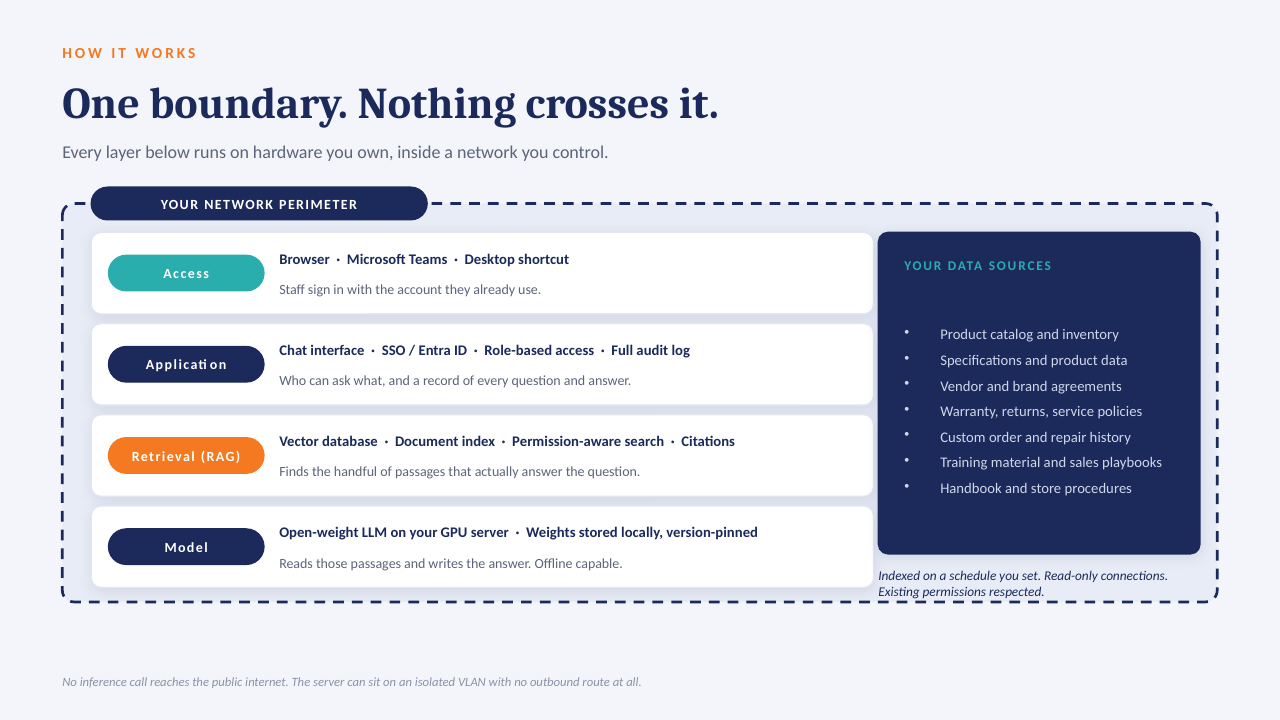
The "ask the data" ideas on this board are designed to run on a GPU server inside your own network — an open-weight model over your own documents, cited answers, no per-seat licence, nothing leaving the building. The short deck below explains how it works. Scroll through, or download it as a PDF.